|
Historical inflation rate
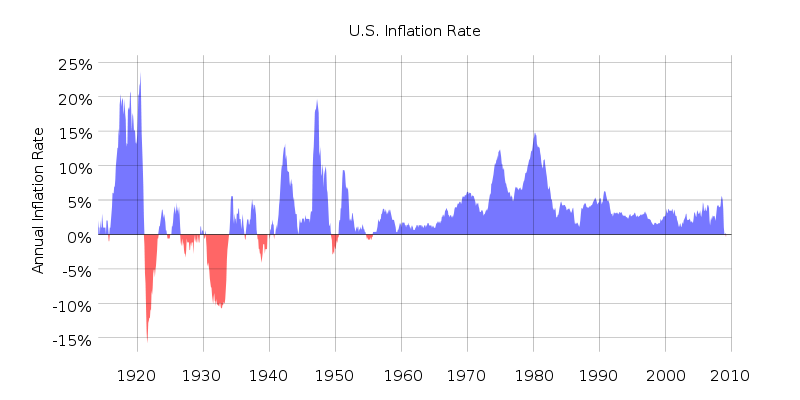
Historical inflation rate The historical inflation rate has gone from a negative to a sharply higher positive in the last quarter of 2009. In the last 2 months of 2009 inflation spiked from a negative .2% to a positive 1.8% for November 2009 and in December it was 2.7%. In just 2 short months the inflation rate of a .2% negative changed to a positive 2.7%. If you are a person who is concerned about high inflation because of the Federal Reserve pumping trillions of dollars into the US and the world banking system then it’s time to pay attention. Here is a chart of the historical inflation rate that goes all the way back to 1901 and up to December 2010. In this chart you can see the historical inflation rates that we have had very high inflation within our own history. For most of 2009 the historical inflation rate was negative at -2.1% then suddenly in December that entire negative disappears in just 2 months to a positive 2.7%. What will this mean for 2010? Why high inflation will be the result? The amount of money the Federal Reserve is putting into the banking system is unprecedented. We are in uncharted historical dollar amounts. A person in the business of forecasting the economy usually only looks a one thing. They make a decision based on that one thing. Like the money supply in the banking system for example. There’s a problem with the one thing, there’s a lot more going on than the more than doubling of the money supply in the banking system. Here are just some of the many problems that the Federal Reserve and the American people face. The bailout of Freddie and Fannie has already cost $400 billion. It has been said that an additional $800 billion has been set aside to continue bailing out the 2 largest mortgage originators in the country, holding 2.5 trillion in mortgages between the two. The total bail out money is 1.2 trillion. That’s half the mortgages in those two companies. Then we have the more than doubling of the money supply from $800 billion to 1.8 trillion in the banking system. We add this all to the 1.4 trillion deficit spending by the federal government for 2010. Then we need to add another $174 billion for a so called jobs bill that only has $35 billion in it for jobs in infrastructure rebuilding , the rest goes to the states to make up for shortfalls in state budgets. This is not in the congressional budget office’s figures because the senate has not passed it as of January 30 2010, but the senate will pass it. This brings the total deficit so far to 1.57 trillion for the year 2010. This is all creating money out of thin air. There has never been anything even close to this in the history in the US economy. Even when you adjust for inflation we are still in uncharted territory. If we just take these figures alone the Federal Reserve has created or is going to create a total of $3.77 Trillion. But there is much more on top of this. There was $500 Billion given to the World Bank to support bailouts in European banks. No one knows were that money went, not even Ben Bernanke. This brings us to a total of 4.27 Trillion out of thin air in a 24 month period 2009 and 2010. You cannot create that huge amount of money without the results ending in very high inflation. This will lead to hyper inflation of the US dollar in 2011 We do have some historical president for a banking system collapse that took place from 1988 to 1995. But the total cost of that bank bailout was $500 billion over a 7 year period not 4 trillion over a 2 year period. So where does this lead to from this point. There are two periods in the Historical inflation rate were inflation got as high as 18% and even 20% but the problems that we have are many times larger than anything in the Historical inflation rate even when inflation adjusted. There’s another problem with the Historical inflation rate numbers reported by the government. It never seems to be in sync with the real cost increases that we experience in our weekly and monthly expenses. Here are a few examples. Some of the largest for 2009 would be the cost of gasoline which at its lows back in January was $1.60 a gallon now it’s 2.70 a gallon that’s a 60% increase in price in 12 months. Then there are commodities when taken as a basket are up year over year average of 15% for the last 10 years. Even this year copper was $1.50 a pound and it is back up to $3.50 a pound. That’s an increase of 130%. The cost of energy in 2009 has gone up between 10% and 30% depending on where you live. In my state there was a 10% increase and in Florida there was a 30% increase. Then the government tells us inflation was negative - 2.1% for most of 2009. How does that figure in? The math just doesn’t work out and it never does. There is something really wrong with the Historical inflation rate and the way Federal Reserve figures and what things really cost in the real world. I always said these guys are living in a fantasy land. Most Americans don’t have the luxury of paying their bills with fantasy land money. If the Federal Reserve believes there own phony Historical inflation rate to determine what to do with monetary policy, we are guaranteed to pay a very heavy price for there miscalculation. This price will be a severely devalued currency over the next 2 years. I believe the path we are on will lead to hyper inflation by the end of 2011 and escalate into a currency collapse in 2012. I think it will be a really bad currency collapse that will lead to a totally worthless dollar. You can’t dump $4 trillion into a monetary system without severe consequences. The congressional budget office projections are for $1 trillion plus deficit spending as far out as 10 years. This can only lead to an economic disaster of biblical proportions. If the dollar was to devalue by 100% over the next 3 years, this would work out to a doubling of prices on everything we buy. Could you afford that on just a few % of a pay increase over the same period? If your employer even gives you an increase in pay. A friend of mine just got a 3% reduction in pay so he could keep his job. This reduction in pay was based on the phony Historical inflation rate reported by the government. I know for a fact what the government uses to gauge inflation is changed and manipulated to show very low inflation no matter how high it really is. The government just takes out items that are going up in price and replaces it with other items that are stable or going down in price as they see fit to get to the result they want. Don’t bet the farm on the numbers reported by the government. In the book 2012 what’s really going to happen. You will find out. How it all started. Specifically who is doing it to the American people? I’ll give you their names. I will tell you why the elections in 2010 will do no good in changing the direction we are headed in. Why it’s being done intentionally by the very government that is supposed to protect us. How our current political system has everything to do with all the current problems. How the so called stimulus package passed in February 2009 will do nothing to help the economy. I will show a monthly projection of the economic decline. How it will destroy our currency and our government. What 2013 will look like after the government has collapsed. How this condition will last between 7 years and could go on for 20 years, until 2033. What the 2013 aftermath will look like. The chapters of 2012 are as follows 1. How I know 2. How we really got were we are 3. General summary of the current economic conditions 4. The Federal deficit problem. 5. Oboma promised no new taxes. 6. Liberalism or communism. 7. To stimulate or not to stimulate. 8. 2010 to 2013 the final chapter.
|